Back to blog
MarketsSentiment

How to read the Crypto Fear & Greed Index

Atex Hub Team2026-06-249 min read

What crypto's most-watched sentiment gauge measures, how to use it, and where it misleads

Markets are driven by two emotions as much as by any spreadsheet: the fear of losing money and the greed of missing out. The Crypto Fear & Greed Index tries to bottle that mood into a single number between 0 and 100, and it has become one of the first things traders glance at each morning. Used well, it's a mirror for your own bias. Used badly, it becomes a fake trading signal that talks you into buying tops and selling bottoms.

What the number actually represents

The index is a sentiment gauge, not a price forecast. A low reading means the crowd is fearful — selling, hoarding cash, bracing for worse. A high reading means the crowd is greedy — buying eagerly, chasing gains, convinced the trend continues. It measures how people feel about the market right now, aggregated from behaviour rather than opinion polls.

The scale breaks into five zones:

  • 0–24 · Extreme Fear — investors are nervous; prices have often already fallen hard.
  • 25–49 · Fear — caution dominates and buyers hesitate.
  • 50–54 · Neutral — no strong emotional lean either way.
  • 55–74 · Greed — optimism is building and money flows in.
  • 75–100 · Extreme Greed — euphoria; the market may be overheated.

You'll find it live at the top of our markets page, refreshed daily.

What goes into the score

No single input decides the number. The index blends several behavioural signals, each weighted so that no one factor dominates:

Volatility. Current price swings are compared against recent averages. Unusually sharp drops push the reading toward fear.

Market momentum and volume. Heavy buying volume on rising prices reads as greed. Sluggish or one-sided selling reads as fear.

Social media activity. The pace and tone of posts about crypto — how much people are talking, and how excitedly — feeds the mood estimate.

Bitcoin dominance. When money crowds into Bitcoin as a perceived safe haven, that defensiveness reads as fear in the broader market. When capital fans out into riskier altcoins, it reads as greed. (If that mechanic is new to you, Bitcoin dominance explains it in depth.)

Surveys and trends. Some versions add search-trend data or periodic sentiment polls.

The exact recipe varies by provider, and the number is deliberately a blunt instrument. It's designed to capture a vibe, not to be precise to the decimal.

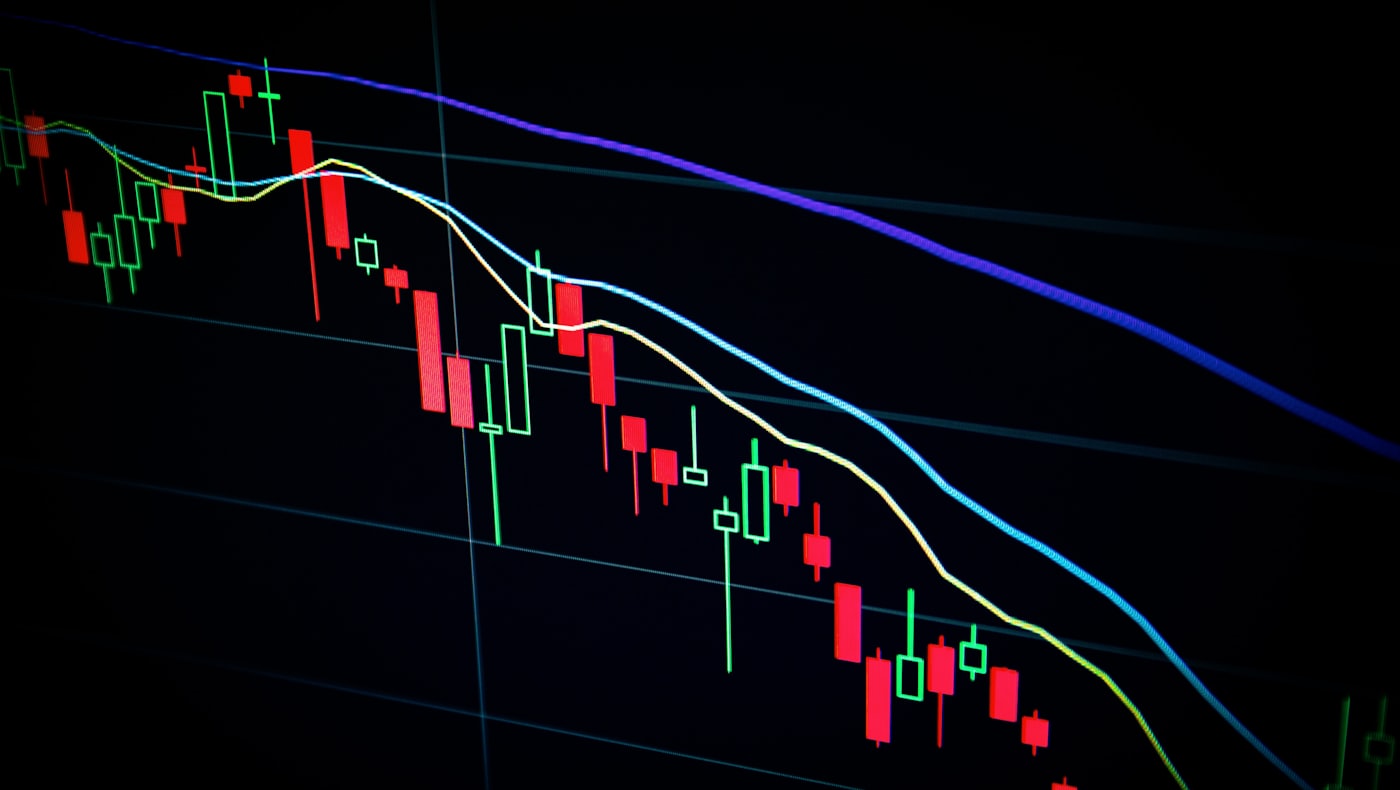
A red candlestick chart trending sharply downward

The contrarian logic — and its limits

The index draws its reputation from one of investing's oldest maxims, usually credited to Warren Buffett: "Be fearful when others are greedy, and greedy when others are fearful." The reasoning is sound. By the time everyone is euphoric, most of the buying is already done and there are few new buyers left to push prices higher — a fragile setup. By the time everyone is terrified, most of the panic selling has happened and assets may be genuinely cheap.

So Extreme Fear can mark moments of opportunity, and Extreme Greed can flag froth. Historically, some of the best entry points arrived when the needle was buried in Extreme Fear and the headlines were darkest.

Here is the honest caveat: sentiment can stay extreme for a very long time. In a strong bull run the index can pin near Extreme Greed for weeks while prices keep climbing — sell on the first "greed" reading and you leave enormous gains on the table. In a brutal bear market it can sit in Extreme Fear for months while prices grind lower. The index tells you the temperature of the room. It never tells you when the weather changes.

How to use it without fooling yourself

Treat the index as one data point among many, and mostly as a check on your own psychology rather than a trade trigger.

Check it against yourself first. The single most useful move is to compare the number to your own gut. If the gauge is screaming Extreme Greed and you feel a powerful urge to pile in before you "miss out," that alignment is a warning: you're feeling exactly what the crowd feels, at exactly the moment crowds are usually wrong. Conversely, if the gauge shows Extreme Fear and you're paralysed, that's worth noticing too.

Use it to pace decisions, not make them. A high reading is a cue to slow down, size positions smaller, and avoid chasing. A low reading is a cue to have a plan ready rather than to freeze. Neither is a command to act immediately.

Pair it with real market structure. Read the index alongside total market cap, 24-hour volume, and the trending coins shown on the markets page. Sentiment plus context beats sentiment alone.

Watch the trend, not just today's value. A number moving from Extreme Fear toward Neutral tells a different story than one sliding from Greed toward Fear, even if they cross the same value on the way.

Colourful line charts on trading screens

Common mistakes

  • Treating it as a buy/sell button. "Extreme Fear, therefore buy" ignores that fear can deepen for months. The index sets context; it doesn't time entries.
  • Over-reacting to one day's reading. Sentiment is noisy day to day. A single spike means little; the direction over a week or two means more.
  • Forgetting it's backward-looking. Every input — volatility, volume, dominance — describes what already happened. The number is a snapshot of the recent past, not a prediction.
  • Confusing sentiment with valuation. A greedy market isn't automatically overvalued, and a fearful one isn't automatically a bargain. Fundamentals and price can diverge from mood for a long time.
  • Letting it override a plan. If you've decided to accumulate steadily regardless of mood, a scary number shouldn't make you abandon the plan — that's the crowd behaviour the index is supposed to help you resist.

Quick answers

Does the index predict prices? No. It measures current and recent sentiment. It can hint at crowded extremes, but it has no forecasting power over what happens next.

Is a low number always a buying opportunity? Not reliably. Extreme Fear has preceded rebounds, but it has also preceded further declines. It flags cheapness sometimes, never always.

How often does it update? Typically once a day. Because it smooths several inputs, it moves more slowly than live prices — treat it as a mood barometer, not a tick-by-tick feed.

Should I trade purely off it? No serious approach uses one indicator alone. Its best use is as a bias check and a piece of context beside price, volume, and your own strategy.

The takeaway

The Fear & Greed Index is a quick, honest read on the emotional state of the market — and its greatest value is turning that read back on yourself. When the gauge and your gut are both shouting the same thing, the crowd is usually most vulnerable, and that's exactly when a pause pays off. Use it to stay level-headed, pair it with the total market cap and trend data on the markets page, and remember what it is: a thermometer, not a crystal ball. When you've made a calm decision, you can act on it non-custodially with an instant swap.

Was this helpful?